
Learn How to Read Your Lumbar MRI
If you don't like reading, I have a YouTube video on "How to Read Your Lumbar MRI."
T2 Images | Slicing 101 | Sagittal Images | Axial Images | The Algorithm | The Quiz | Where Am I? | My YouTube Video on How to Read your MRI |
 On this page, I will teach you the basics of how to read your MRI images for the most typical causes of chronic back and/or leg pain.
First, I will go over the pertinent lumbar anatomical structures as visualized on both sagittal (view from the side) and axial (view from underneath) MRI imaging, and then we will go over the typical presentations of some of the common pain-causing spine conditions.
However, before you read any further, I strongly suggest that you visit the Disc Anatomy page in order to learn or review the basic lumbar spine and disc anatomy. Why? Because MRI and CT images are not nearly as easy to read, when compared to the pictures/cartoons on the Anatomy page. it will definitely be tough going if you don't have that basic understanding before tackling this page!
One of the most challenging part of learning how to read your MRI, besides just figuring out what the heck you're looking at, is figuring out what level you are at. I mean, are you looking at the L5 disc, the L4 disc, the L3 vertebral body? Professionals typically have expensive imaging software (like PACS) which automatically tells you via a cut line; however, I will assume that you don't have such software and will teach you how to figure where you're at the old-fashioned way.
If you want to follow along, now might be a good time to put your MRI disk into the computer and double-click on the T2 images in order to open them up for viewing. There are many different types of viewing software out there, so you're going to have to play around with the one that came with your disk in order to get these images up and running—I'll leave that work to you. Or, if your tech savvy, you can download a program called Onis 2.5 (which is the same one I used during my coaching sessions) which is quite powerful and includes cut lines.
WARNING: Never try to diagnose yourself using information gleaned from these pages. This information is for educational purposes only. Also remember it is very difficult for even primary health care providers to read a MRI, let alone the general public. If you're confused about your MRI findings or don't agree with the radiology report, why don't you and I look over your images together during a GoToMeeting coaching session? You can learn all about this coaching on my coaching service page.
You may also read what my past clients have said about my coaching service here: the testimonial page.
Meet the T2 Weighted MRI Images:
Now I don't want to get too complicated here, but for our purposes there are basically two types of MRI images that come on that MRI disk of yours: T2 weighted images and T1 weighted images. And of these two image types, the T2 weighted images are the most valuable, so that's what we'll start with.
Why start with T2 weighted imaging? Because T2 weighting accentuates inflammation and as we know from the other pages, that inflammation is often the "culprit" behind many pain-generating lumbar spine conditions. For example, a full thickness annular tear may sometimes cause a pocket of swelling and inflammation within the back part ( posterior and/or posterolateral part) of the disc which in turn shows up on T2 weighted images as a region of "hyperintensity" (i.e., a region of bright white). This phenomenon is called a HIZ (high intensity zone) which, according to the medical literature database, often indicates the presence of a full-thickness annular tear that is painful upon pressurization during provocative discography. You can learn more about annular tear and the HIZ finding on my annular tear page.
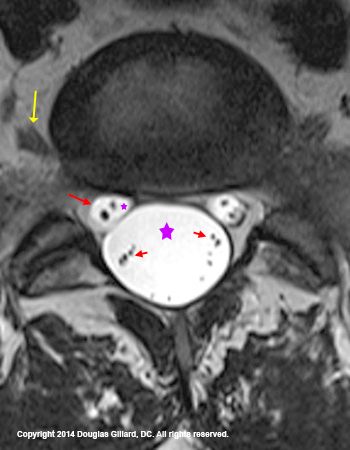
With T2 weighting, you can also see the nerve roots inside of the thecal sac and, in some cases, even the dural sleeves (aka, root sleeve) of the traversing nerve roots (left image). Such visualization may allow for the identification of some of the more rare causes of chronic back and leg pain, such as arachnoiditis, cancer or nerve tissue tumors.
The figure left is a T2-weighted axial image which is cut through the L5 disc. Note the very large and round thecal sac which is filled with cerebrospinal fluid (large purple star and extremely bright white). At 2 o'clock and 10 o'clock, you can see the traversing S1 nerve roots (larger red arrow is pointing at the reading-left one) which is also filled with cerebrospinal fluid (tiny purple star). This MRI is of such high quality you can actually see the sensory and motor nerve root with in the traversing nerve roots. finally, you can also see the exiting L5 nerve roots (yellow arrow).
Together, these three circular structures (the thecal sac, and the two traversing nerve roots) make up a "Mickey Mouse" appearance which is typically only seen at the L5 and sometimes L4 level.
Little shaky was what I just said? Check out this labeled axial image which may help you understand the roots.
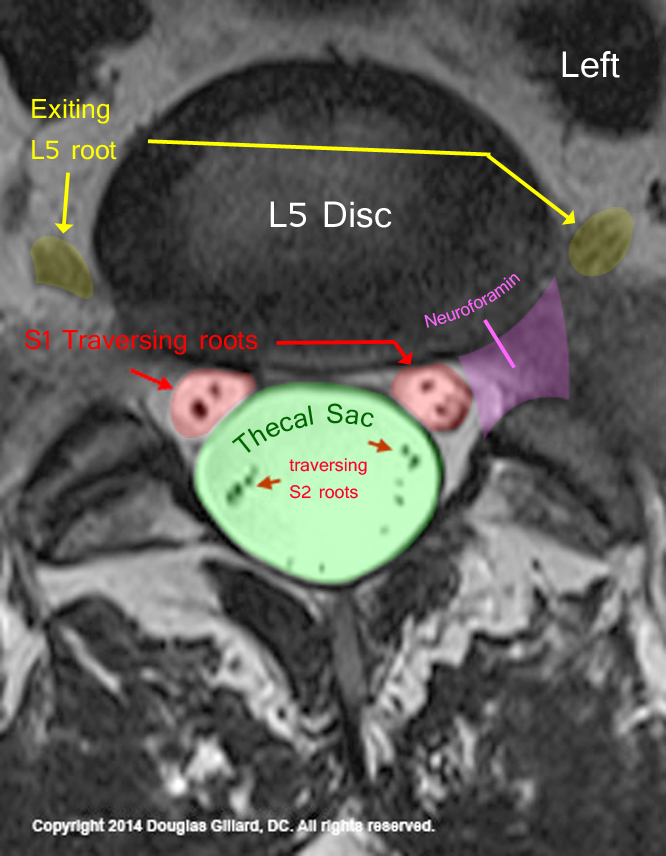
Slice & Dice: What the heck does an MRI machine do?
 The MRI machine has the capability to re-create your lumbar spine, slice by slice, in three planes: a view from the side (sagittal), front (coronal), and bottom-up (axial). Typically, the coronal series is not performed.
Unlike an x-ray machine which creates a compressed one-slice picture of the entire lumbar spine (it is like the spine was run over by a steamroller and smashed into one view), MRI (and CT) creates a sequential (in order) multi-slice series of images, which are typically taken from left to right, at intervals (aka: cuts or slices) of 3-5mm. By employing this strategy, every nook and cranny of the lumbar spine is captured on at least one slice, which allows for the viewing of even the smallest of pathologies.
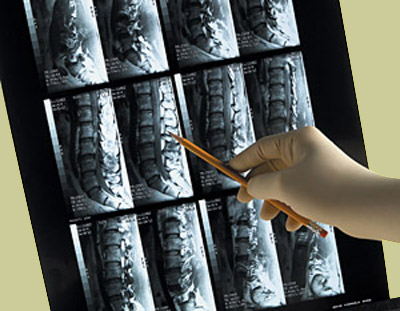
The figure above is a T1-weighted MRI film of 12 sequential slices through the lumbar spine. This series of images could have easily been put into disk format.
 In order to help you understand this slicing concept of MRI technology, consider this analogy.
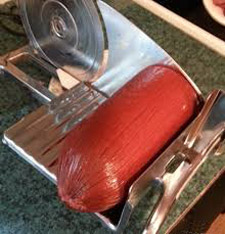
Upon your request, a deli worker will grab a log of salami (analogous to your body), turned on the slicing machine (analogous to an MRI machine), and, from one of the ends, begin slicing off thin pieces of salami, which you can then use for your sandwich.
Such slices of salami are analogous to the axial MRI images.
I suppose you could put the salami log in the deli slicer lengthwise (not shown), which would give you sagittal slices of salami for a very long sandwich! These long slices of salami would be analogous to the MRI sagittal images.
Sagittal Images
The sagittal MRI images are hands down the easiest to look at and understand. As mentioned above, MRI re-creates the lumbar spine by producing a sequential series of images so that every part of the lumbar spine is captured in an orderly fashion.
There are three important sagittal regions that we need to discuss: the mid-sagittal region, the para-sagittal region and the foraminal-sagittal region.
Mid-Sagittal Region
As the name implies, the mid-sagittal region is composed of those few slices that were taken from the middle of the lumbar spine. For those of you who don't understand that sentence, let's use the samurai warrior analogy.
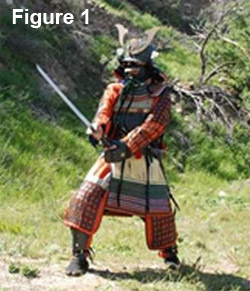 Pretend that a samurai warrior (figure 1) with a razor sharp sword is facing you. He raises his sword high overhead and then comes down with the sword, first slicing through the crown of your head. Then the blade continues downward through the midline of the body passing between your eyes, through the bridge of your nose, through the breastbone, through the belly button, and finally through the symphysis pubis, which results in you being cut exactly into two pieces.
If we looked at either side of the bisected lumbar spine, the view would be that of the mid-sagittal cut—a cut right down the center.
Got the idea now? (Sorry for the gruesome analogy, but that seems to work.)
Although only one cut will represent the true mid-sagittal view (a cut right down the very center of the body), the mid-sagittal region technically extends laterally (to the side) until it totally encompasses the space that is occupied by the thecal sac. (figure 6) [2] *I personally don't like this rule, for thecal sacs come in many different sizes (figure 7) and prefer to say the mid-sagittal region extends 7mm on either side of the true mid-sagittal cut.
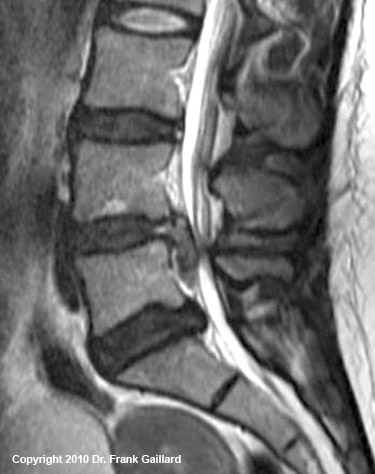
How do you tell which sagittal image represents the true mid-sagittal cut? Simply scroll through the images until you find the one that has the largest looking spinal canal (black line on figure 2).
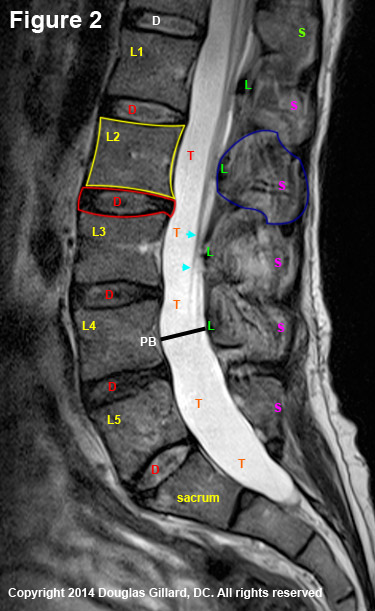 Figure 2 is a true mid-sagittal cut through the lumbar spine, where the patient's belly button is to the left of the image and the back to the right.
There are two main osseous (made of bone) structures that are clearly visible on the mid-sagittal view of a vertebra: the square-shaped vertebral body of the vertebra (yellow outline) and the spinous process (blue outline) of the posterior arch. The junction of the spinous process with the laminae make up the anterior border of the posterior arch which also forms the back of the central canal.This is covered with ligamentum flavum (Green L).
The extremely hyperintense space (almost pure white) between the vertebral bodies and posterior arch is the thecal sac (red T), which of course is filled with CSF. This structure may or may not completely fill the vertebral canal, which is the space between the posterior vertebral body (PB), pedicles, and lamina as represented by the black line I have drawn. Remember, this should measure 20 mm.
In the mid-sagittal view, the nerve roots of the cauda equina are typically not terribly visible (white-blue arrowheads) except as they get closer to their neuroforamina (not shown).
Situated between each of the five lumbar vertebral bodies, are the five lumbar discs (red outline & D) that carry about 80% of the axial-load of the body and act as a pivot-point for trunk motion.
Clinically speaking, this view is ideal for picking up a sometimes pain-producing condition called central stenosis, which occurs when the thecal sac gets squeezed and inflamed by a narrowed central canal. (Learn more about central stenosis)
Para-Sagittal Region
 As the name implies, the para-sagittal regions are composed of slices that are lateral to (to the outside of) the mid-sagittal region but medial to the beginning of the neuroforamen.
How can you tell if a cut is out of the midsagittal region?
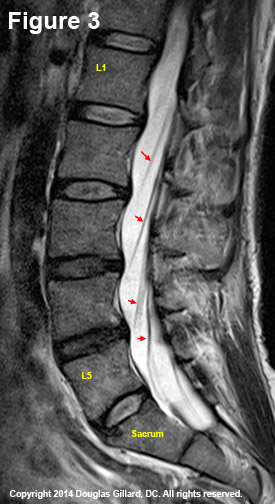
As noted on figure #3, you start to see the traversing nerve roots show up (red arrows). Recall that the transversing nerve roots are still within the contents of the thecal sac (the exception is at L5 where it has already budded out of the thecal sac).
When it becomes time for the traversing nerve roots to do their job, they can be seen moving anteriorly in their oblique posterior to anterior, superior to inferior direction. They cannot be seen, however, actually emerging from the thecal sac on these views.
Another way that you can tell you are away from the mid sagittal region is that the horizontal dimensions of the vertebral canal get progressively smaller. In fact, once you hit the beginning of the intervertebral foramen (a.k.a. neuroforamen) zone (as we will see below) you can no longer see any vertebral canal.
The parasagittal region is very important for looking for potential pain generators. For example, lumbar disc herniations typically occur in the paracentral zone and are visualized on para sagittal cuts.
Symptomatic facet joint cysts are also typically found in the paracentral zone, only they are found more posteriorly positioned as compared to a disc herniation.
In patients who have degenerative spondylolisthesis, the inferior articular process often "guillotines" into this para sagittal region (– specifically, in the paracentral zone and/or proximal foraminal zone.
 Within the lateral recess, the traversing nerve roots (the ones going down to the next vertebral level) are also vulnerable to posterior compression by osteoarthritic change of the superior articular processes, a condition called lateral spinal stenosis. [2] (Learn more)
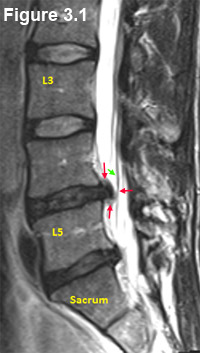
Figure 3.1 is a cut through the para-sagittal zone / lateral recess that demonstrates a moderate-sized disc herniation (red arrows).
Note the presence of a moderate -sized disc herniation at L4/5 (red arrows). If you look closely, you can also see the herniation touching one of the traversing nerve roots and even pushing it a little bit off course (green arrow). This is sometimes called "tenting."
As we have learned on the disc herniation page, the "one-two punch" of compression and inflammation can lead to an extremely disabling condition called sciatica (radicular pain is a better word to use if you're a medical professional. You can learn more about sciatica on my sciatica page.
As you will learn (or may have already learned) on the Disc Herniation Page, disc herniations that are big enough to actually deviate a lumbar nerve root are not commonly seen in asymptomatic patients [1] and are often problematic. the research indicates that approximately 30% of all adult humans without low back pain will have a disc "protrusion." Remember, I disc protrusion is a small disc herniation (<4-5 mm). But bigger herniations, which are called "extrusions" and "sequestrations" are rarely present in asymptomatic people.
Foraminal-Sagittal Region
As the name implies, the foraminal-sagittal region (a term not commonly used) is a region lateral to the para-sagittal region which encompasses the all-important neural foramina (aka, intervertebral foramina, IVF, neuroforamina).
 As you may recall from the Disc Anatomy Page, the neural foramina are bony openings located on either side of the spine that allow the spinal nerve roots to leave the spine and carry their important information to every nook and cranny of the body.
The foraminal-sagittal region, which is typically represented by only one slice, demonstrates some new anatomy that includes the exiting nerve roots (and sometimes even their accompanying blood vessels).
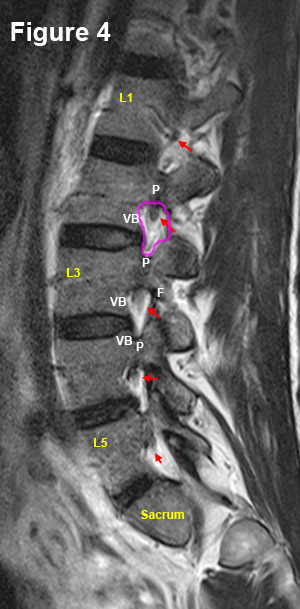
Figure 4 is a foraminal-sagittal cut that demonstrates the boundaries of the right neural foramen (pink circle) quite nicely: The roof and floor are created by the pedicles (P) (the strongest part of the vertebra) of the vertebra above and below, respectively. The posterior boundary is created by the superior articular process of the vertebra below, and the anterior boundary is created by the disc and vertebral body (VB).
Note that the neural foramina are hyperintense structures, secondary to their high fat content (fat has a high water content and therefore glows white on T2 MRI). This color scheme provides a good background for the hypointense exiting nerve roots (red arrows).
Although disc herniations typically occur within the paracentral region of the spinal canal, they may also occur within the neural foramina. These foraminal disc herniations (aka: far lateral disc herniations) can be particularly troublesome, for not only are they tough to reach surgically, they may also compress the ultra sensitive dorsal root ganglia (DRG) of the dorsal lumbar nerve roots which typically live within these foramina. Such compression, which is still considered a form of lateral stenosis, may result in severe and debilitating radicular pain on the side affected.
Just as the lateral recess may become stenotic from a thickening of the superior articular process (part of the facet joint), the neural foramen may also become stenotic from osteoarthritic thickening of any of the structures that create the bony hole.
Axial Images
 Although the axial images are much tougher to get a handle on, they are very informative. For example, on these images you can see the exact location of facet cysts, disc herniations, stenosis, and fractures. Therefore, it is imperative that you understand them.
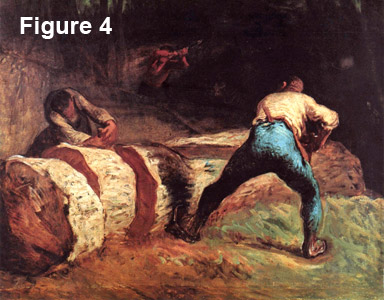
In addition to the deli slicer analogy previously employed, we can also use the Lumberjack analogy to describe how the views are created by the MRI machine.
Let's pretend that your body is a log lying face up in the forest. Two lumberjacks find you, pull out their crosscut saw, and proceed to cut you up, slice by slice. (figure 4) The resultant pieces of wood are analogous to the cuts that are seen when we scroll through the axial images on your MRI disk, except these cuts are 3-5 mm thick, and not the 12-18 inches cuts that the lumberjacks would make.
Axial Anatomy: find the football and the wishbone!
As my coaching clients know, I like to begin teaching folks how to read axial images by having them look for the slingshot-like posterior arch and the football-like intervertebral disc. Then, in order to confirm that they are at the disc level, I have them look for the bright white thecal sac which should be between the two structures. This teaching method is what we will now work on.
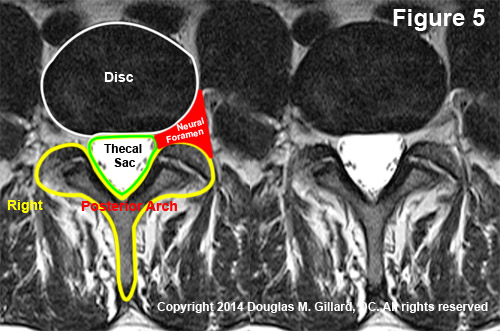 Figure 5 is a real disc-level T2-weighted axial MRI image in which I have outlined the disc, (white) the thecal sac, (green) and the posterior arch (yellow). I have also colored the left neural foramen red and marked the right side of the image.
*It is important to note that all MRI and CT axial images, whether they be on disk or film, are reversed with regard to sidedness—anything on the right of the image is in reality on the left. This is because we are really looking up from beneath the slice and not down from above.
In order to help train your eyes, I have placed two identical images on each side of the figure. First look at the image that is marked and study the structures. Then look at the unmarked image on the right and practice visualizing those structures without the aid of the lines that I have drawn. Keep going back and forth between the two images until you feel very comfortable that you don't need the lines. Now mouse click through the axial images on your DVD and practice finding the football and wishbone.
Okay, now it's time to look at the structures more in detail:
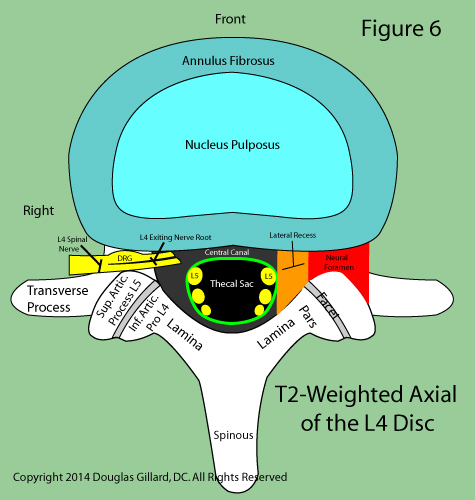 Figure 6 is a cartoon of a typical lumbar T2-weighted axial image through the L4 disc. Got it down? see if you can pass the quiz that I give to my students (Take the Quiz)..
Note that the disc is composed of two parts: the tough annulus and the Jell-O-like nucleus, the latter of which is typically more hyperintense on T2-weighted MRI.
Because you are having back pain, the chances are good that your discs are quite degenerated. Therefore, you probably will not be able to see the nucleus because your entire disc will be black—an indication of DDD).
Note the parts of the posterior arch and the superior articular processes of the vertebra below (not visualized), which join the inferior articular processes at this level and form the facet joints.
Also note that the traversing L5 nerve roots (the ones destined for the neural foramina below this level) have not yet budded off the thecal sac. The exiting L4 nerve roots, however, have clearly butted off the thecal sac and are coursing out the same-level neural foramen.
In reality, many of you will not be able to see all of these structures this clearly because the quality of MRI images varies greatly between MRI centers.
Disclaimer: remember folks, never second-guess the radiologist or your doctor with any information you may glean from this tutorial! Again, This material is for educational purposes only. As I stated above, I do offer a consultation service and I would be happy to go over your images and talk with you about your own unique
The Inspection Algorithm
In order to search your images for possible pain generators, I will teach you a simple algorithm that is to be used at every disc-level image.
Inspect the Disc
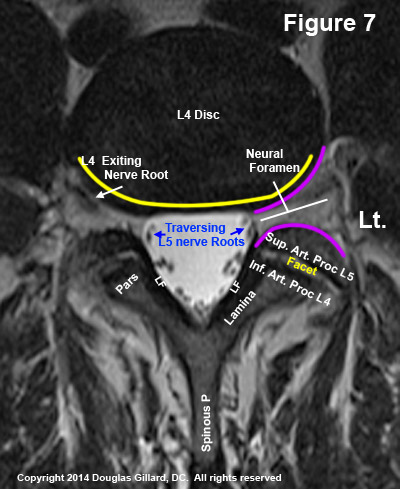 Once you have found the desired disc level (learn how to find it desired level down below), begin the algorithm by looking at the disc. Specifically, (we will use figure 7) carefully examined the posterior and posterolateral margins of the disc (yellow line), noting any focal outpouchings (prominent bumps) that may be present. If you see one, then you're most likely looking at a disc protrusion. Do you see such an outpouching in figure 7? The answer is no.
Another pathology to look for is a general bulging (i.e., a disc bulge) of the back of the disc which can narrow the neural foramen and compress the anterior spinal canal. Such narrowing can contribute to lateral and central stenosis, respectively. What about figure 7, do you see any disc bulging? The answer is no.
The final piece of disc pathology to look for (for our purposes) are indications of an annular tears. Please recall from the annular tear page that an inflammatory process may occur in the posterior one-third of the disc following an annular tear into that region. This inflammatory process may show up as a region of dense hyperintensity (bright white) in the outer annulus. Can you see an annular tear on this image? The answer is no.
Inspect the Neural Foramina and Thecal Sac
Next, let's look at both of the neural foramina in order to make sure they are open and that no stenosis has occurred (i.e., a constriction between purple lines of figure 7).
Recall that the neural foramen may be narrowed anteriorly by osteoarthritic thickening of the posterolateral vertebral body, by a posterolateral disc herniation, or by a bulging disc. The foramen may also be narrowed posteriorly by osteoarthritic thickening of the superior articular process. What about it, do you see any narrowing of the foramina in figure 7? The answer is no.
Next, let's turn our attention to the thecal sac. Normally the thecal sac should be symmetrically shaped into a shield-like configuration (figure 7) with the lumbar nerve roots visible and lined-up along its periphery (this is certainly not always the case).
The delicate thecal sac, however, is vulnerable to compressive forces and may be compressed by central and paracentral disc herniations, osteoarthritic-thickening of the posterior vertebral body or laminae, or hypertrophy of ligamentum flavum. Any of the aforementioned compression mechanisms would result in central stenosis.
Do you see significant compression-related deformity of the thecal sac in figure 7? The answer is no.
Inspect the Posterior Arch
Although CT is the gold standard for detecting fractures of the posterior arch, sometimes they are still visible on MRI.
Therefore, carefully inspect the posterior arch for signs of cortical disruption (breaks in the outlines of the wishbone), especially at the region of the pars interarticularis, is imperative.
Also re-assess the "V" of the wishbone in order to make sure that ligamentum flavum thickening or facet thickening is not compressing the thecal sac.
Finally, observe the relationship between the superior and inferior articular processes in order to ensure that there is sufficient coronal orientation of the facet joint.
Sometimes the facet joints may be orientated too sagittally, which can allow forward slip to occur—a condition called degenerative spondylolisthesis. Learn more about this on the spondylolisthesis page. (read more)
What do you think? How does the posterior arch look in figure 7? The answer is that it looks fine. There is some fat/tissue densities covering part of the right posterior lateral facet region, but that is completely normal. The facet joints are angled obliquely (which means they are coronal enough) and no cortical disruption is elucidated.
Disc Pathology: time for a quiz.
Think you got it down? If so, it's time for one of my infamous quizzes:
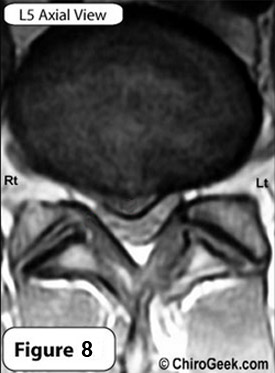 #1) Do you have any idea what is going on here (figure 8)? Go through the algorithm I've shown you; what did you come up with?
After inspecting the posterior margin of the disc, you should have immediately noticed a focal outpouching (bump) of the posterior disc which is representative of a moderate-large disc protrusion (a.k.a. herniation) within the central-right lateral recess. (click here to see, red heart)
If you missed it following the disc inspection, then you should have definitely caught it while you were inspecting the thecal sac, which is smashed in the right front region by the herniation.
Another quiz question: is this a T2-weighted image?
The answer is no. Look at the thecal sac. Is it hyperintense (white)? No, it is hypointense (dark), which means it is not a T2 and most likely the T1-weighted image.
Finally let's look at the neural foramina. How do they look? Notwithstanding the good-sized disc herniation, both lateral foramina are within normal limits and not compressed.
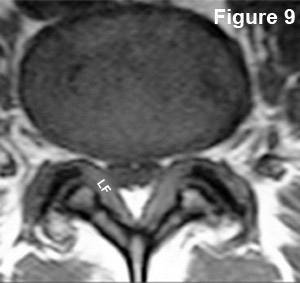 #2) Do you have any idea what is going on here (figure 9)?
How does the posterior disc margin look? Well, there are no focal outpouchings (bumps); however, the entire disc is "bulging" backwards so that it has narrowed the neural foramina as well as the central canal. This condition is called, as you may have guessed, a bulging disc (disc bulge) without focal disc herniation.
What about the thecal sac? First of all, I threw you a curveball: this is not a T2 weighted image... right? The thecal sac is not bright white, but the but hypointense (dark). Therefore, for our purposes, it is a T1-weighted image. You should have also noted that the posterior arch is abnormal. Specifically, ligamentum flavum (LF) (which is usually barely seen) has greatly hypertrophied (second) and has compressed the posterolateral corners of the thecal sac. so what is this condition called? Central stenosis.
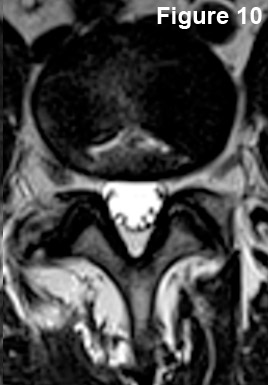 #3) What's going on here? Go through your algorithm, and tell me what you see?
The posterior and posterolateral contour of the disc are normal, for there is neither disc bulging nor disc protrusion. We cannot see the nucleus pulposus on this T2-weighted image, therefore the patient has degenerative disc disease (DDD).
Also, particularly noteworthy is the presence of a fairly hyperintense (white) flattened teepee-like defect in the disc (remember, this should be black), which is indicative of a massive bilateral annular tear within the annulus (click here to see, yellow arrows)
What about the thecal sac?
It looks pretty good as it is symmetrical in shape and is not being compressed or indented by anything. In fact, you can clearly see the traversing nerve roots floating in the CSF without signs of compression. (click here to see, green arrows)
What about the neural foramina? Good job! They look fine and are wide open. Can you see the dorsal root ganglia? (Click here to see, pink arrows)
And finally, what about the posterior arch? It looks absolutely fine with no significant ligamentum flavum thickening, obvious fracture, or facet slip.
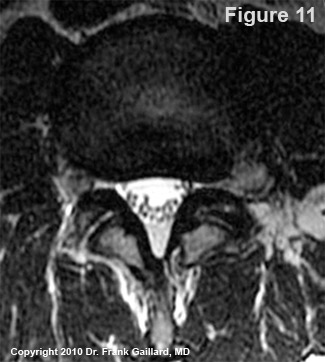 #4) What's going on here? Let's see, the posterior and posterolateral contour of the discs seem to be okay.... are you sure?
Most of you probably missed this one. If you look very closely you might see... something. I'll tell you later.
What about the thecal sac? This is clearly a T2 weighted image (hyperintense thecal sac with scattered nerve roots {they don't always lineup}) that shows a symmetrical and open thecal sac;however, the thecal sac is definitely contacted by the disc and there is some thickening of ligamentum flavum bilaterally. I would call this mild central stenosis, but that's the least of our worries.
What about the neural foramina? The right one looks fine (remember, that is the left side of the image) but the left one as a big problem? Do you see it now?
This is an example of a very large and left foraminal (a.k.a., far lateral) disc herniation that is within the neural foramen. (Click here to see it) Wow! How could you miss that! You can even see the faint outline of the annular tear which let loose this monster!
If this was missed on MRI, which happens more often than you would like to believe, and a traditional microdiscectomy was performed, the surgeon would not have been able to visualize this region of the spine and would have missed seeing the massive herniation; the discectomy would have failed miserably.
Do you see anything else on figure 11? Did you forget to check the posterior arch?
There is one more defect in the left posterior arch. Can you see it now? (click here to see it)
There appears to be a fracture of the left lamina which is typically secondary to a previous discectomy/laminectomy.
Although you really need a case history here to find out what's going on. I don't see any scar tissue in the epidural space, which would indicate previous discectomy, and this defect is not through the pars interarticularis (the weakest part of the posterior arch). So, at this point, the ideology of this cortical disruption is unclear. (*I happen to know it was a fracture from a work-related injury, but you could never tell that by just looking at this picture alone.)
I hope you enjoyed the quiz and did well on it. Please come back here from time to time, for I plan on adding more questions in the not so distant future.
What Level Am I At? Last Axial lesson
At the beginning of this page, I promised that I would show you how to figure out what level of the spine you are at on the axial images without purchasing fancy software. So here goes.
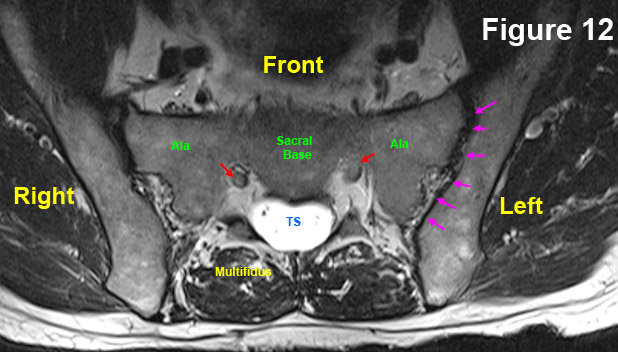 With your T2 weighted axial images open, scroll all the way down through the images until you come to the sacral base, which looks like figure 12. If your MRI Center was too lazy to go down this low, at least look for a picture that looks like this (click here).
Still don't see it? Then your MRI center was either really lazy, or you're not looking hard enough. The only other thing I can say is try scrolling all the way up through the images and look for T12, which typically has ribs attached to the vertebral body. If you know which direction is up, then you can scroll all the way down to the wider L5 lumbar vertebra (assuming the sacred base is not there).
Sacral Base Anatomy
The astute reader might have noticed that there is some different anatomy at this level. Of particular importance are the sacroiliac joints (SI joints) which are outlined with pink arrows. Arguably 5-10% of chronic hard-to-diagnose low back pain may be coming from inflammation of these joints, so they should not be overlooked during the assessment. Also note the sacral base, which is really the vertebral body of the S1 segment. This is what the L5 disc sits on top of. The red arrows are pointing to the S1 traversing nerve roots, which will soon exit through the sacral foramen.
Moving On Up:
In Order to figure out what disc level you are at, always scroll down to the sacral base and then simply work your way up through the images, from disc to disc, counting as you go. That's the trick: count each disc as you go and this way you will always know where you're at. I'll walk you through it:
We are at the sacral base on this DVD. (figure 13)
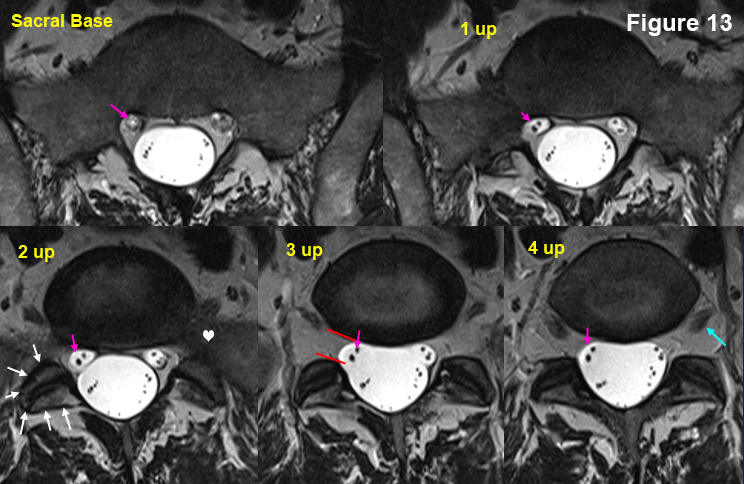 Now start scrolling up image by image:
The first mouse click brings us to 1up, where the anatomy hasn't changed too much. The second mouse click brings us to the "2 up" image, where things have definitely changed (you can see the right facet joint now {white arrows}). The third mouse click brings us to "3 up" where the anatomy continues to change (the S1 traversing roots are just starting to bud off the thecal sac on this image). With the fourth click of the mouse, we have reached "4 up" which is the L5 disc. (In reality, this MRI is of such high quality, that you can really see the L5 disc on 2 up, 3 up and 4 up).
Hopefully, you now have the idea of how to work your way up the spine and by counting the discs as you go up, you will always know where you are.
Still having trouble? I will go up one more level for you, and the rest of the way you're on your own.
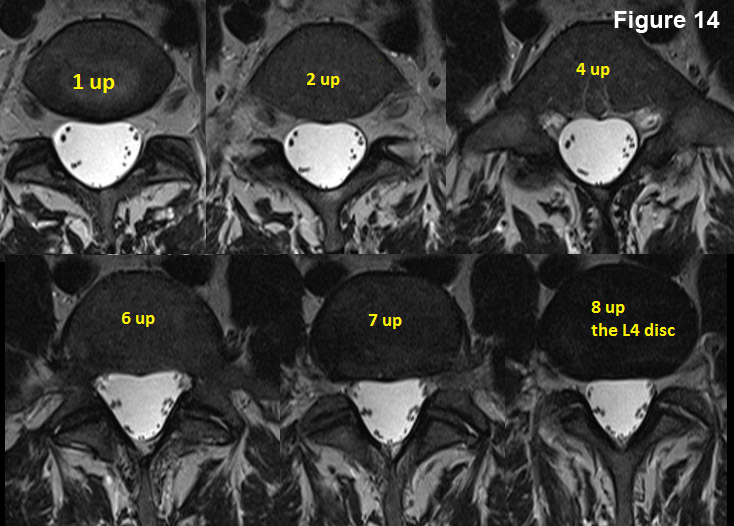 One more mouse click brings you above the L5 disc onto the L5 vertebral body (1 up).
Another mouse click brings you to "2 up".
Two more mouse clicks brings you to "4 up."
Another two mouse clicks brings you up to "6 up." Another mouse click brings you up to "7 up."
And finally, one more mouse click brings you up to the "8 up" image of the L4 disc. Note, that it is blacker than the vertebral body. If it were a healthy disc, you would see a hyperintense (white) nucleus pulposus.
I hope you've enjoyed this tutorial and again want to remind the reader that I do offer a Coaching Service where I go over your MRI disk personally, create a PDF key image worksheet and email it to you, and finally speak with you on the phone (or Skype) for an hour regarding your MRI images and your current pain dilemma.
References
1) Boos N, et al. 1995 Volvo Award in clinical science: The diagnostic accuracy of MRI, work perception, and psychosocial factors in identifying symptomatic disc herniations.” Spine 1995; 20:2613-2625.
2) Botwin KP, et al. Lumbar spinal stenosis: anatomy in pathogenesis. Phys Med Rehabil Clin N Am 2003;14:1-15.